Minerals absorb light at specific wavelengths. Iron oxide swallows blue light and reflects red. Clay minerals dip in the shortwave infrared around 2,200 nanometres. These absorption patterns are as distinctive as fingerprints, and satellites can read them from 786 kilometres up.
That is the entire premise behind AI mineral prospectivity mapping. You point a multispectral sensor at the ground, measure which wavelengths bounce back, and compare the result against known mineral spectra. The maths is surprisingly straightforward. The hard part is cleaning the data well enough to trust the answer.

Sentinel-2 band ratio indices for mineral exploration
The European Space Agency's Sentinel-2 constellation captures 13 spectral bands from visible to shortwave infrared, every five days, at 10-20 metre resolution. The data is free. Dividing one band by another cancels out illumination effects and isolates specific mineral responses. Six ratios do most of the heavy lifting in satellite mineral detection.
Iron Oxide Ratio (B04/B02). Anything above 1.3 is elevated, and that usually means goethite or hematite near the surface. These ferric iron minerals show up around gold and copper systems because hydrothermal fluids oxidise iron as they move through rock. A cluster of pixels with iron oxide ratios above 1.5 tells you that area had hot fluids moving through it at some point. Whether those fluids deposited anything worth mining is a separate question, but you have a target.
Clay Mineral Index (B11/B12). Values above 1.1 flag phyllosilicate alteration: kaolinite, montmorillonite, sericite. These clay minerals form when hydrothermal fluids alter the surrounding rock, and they persist long after the fluids stop flowing. Clay alteration halos around porphyry copper deposits can extend kilometres beyond the ore body itself, making them visible from orbit even when the copper minerals are too deep to detect directly.
Ferrous Iron Index (B12/B8A). Catches ferrous iron in mafic and ultramafic rocks. Elevated values above 1.2 point to rocks that host nickel, platinum group metals, and chromite deposits. Then there are laterite (B04/B03), silica (B12/B11), and vegetation stress (B11/B08). The vegetation stress index is useful in places like the DRC or Papua New Guinea where jungle covers everything. Mineral-rich soils stress the plants above them, and that stress shows up in the infrared before any human eye would notice it.
SAM classification: naming what you find
Band ratios tell you something is anomalous. Spectral Angle Mapper classification tells you what it is.
SAM takes each pixel's spectral curve and compares it against a reference library of laboratory-measured mineral spectra. The USGS Spectral Library Version 7 has reflectance curves for hundreds of minerals measured under controlled conditions. The algorithm treats each spectrum as a vector in n-dimensional space and calculates the angle between them. Smaller angle, closer match. Below 0.10 radians is a confident identification. Between 0.10 and 0.20 is moderate confidence. Above 0.20, the match is too weak to trust.
SAM has a useful property: it ignores brightness differences. A shadowed hillside and a sunlit ridge produce different intensity values but the same spectral shape. The angle between two vectors does not change when you scale one of them. This makes SAM classification reliable across rough terrain where simpler pixel-comparison methods fall apart.
What SAM searches for depends on the target commodity. Gold exploration looks for goethite, hematite, jarosite, kaolinite, sericite, alunite, and pyrophyllite. These are the alteration minerals left behind by the same hydrothermal systems that deposit gold. Copper targets malachite, azurite, chrysocolla, chalcopyrite, and bornite. Lithium exploration scans for spodumene, lepidolite, and petalite in pegmatite systems. Each commodity has its own mineral checklist, and SAM runs all of them in a single pass.
Cloud masking and vegetation correction
None of this works on raw satellite data. A thin cirrus cloud looks nothing like goethite, but it will throw off your band ratios completely. Sentinel-2 ships a Scene Classification Layer (SCL) with every image that labels each pixel as cloud, cloud shadow, water, snow, or clear. You mask out clouds (SCL values 8, 9, 10) and shadows (SCL 3) before computing anything. Water pixels (SCL 6) get dropped entirely. Running mineral analysis on ocean surface produces nonsense, but an automated system will happily do it if you forget to check.
Vegetation is trickier. You cannot mask it out in tropical exploration without eliminating your entire study area. Instead, you calculate NDVI (normalised difference vegetation index), and where it exceeds 0.4 you reduce confidence by 40%. The mineral signal is still there under the canopy. It is just attenuated. The analysis reports vegetation coverage percentage so the geologist reading the results knows how much weight to put on them. An area with 3% vegetation cover and elevated iron oxide is a strong target. The same reading under 70% cover might be real or might be noise.
Cross-validation against known deposits
A spectral anomaly is not a deposit. It is a suggestion that warrants ground-truthing. The USGS Mineral Resources Data System (MRDS) records over 300,000 known mineral occurrences worldwide. When a detected anomaly sits on top of a recorded deposit, your confidence goes up. When it sits 200 kilometres from the nearest known occurrence in a region nobody has systematically explored, that is a different kind of interesting.
Both results are useful. Coincidence with known deposits validates that the spectral method works in that specific geological setting. Anomalies in blank spots on the map are potential new discoveries that existing databases have missed. Junior exploration companies and geological consultants screening new concessions care most about the second category: is there something here that nobody has looked at properly?
The economics of target selection
A regional geological survey runs $50,000 to $200,000. A single drilling campaign costs $500,000 to $2,000,000. The industry discovers an economic deposit roughly 0.5% of the time. For every successful mine, 199 exploration targets went nowhere. Most of that money proved that nothing was there.
AI spectral analysis does not replace drilling. Nothing replaces putting steel in the ground. But it filters your target list before you spend money on mobilisation and logistics. If a satellite screening flags 5 targets in a 500 km² concession, and 3 of them show coincident iron oxide alteration, clay minerals, and MRDS-corroborated occurrences, you know where to put your first drill holes. The alternative is gridding the entire concession with soil geochemistry, which takes months and costs more than a year of satellite prospectivity subscriptions.
For investment due diligence, the calculus is even simpler. Before committing $2 million to acquire mineral rights, a $49 spectral screening tells you whether the concession even has the alteration signatures you would expect for the target commodity. If the entire area shows flat, unaltered spectra with no anomalies, that is information worth having before you write the cheque.
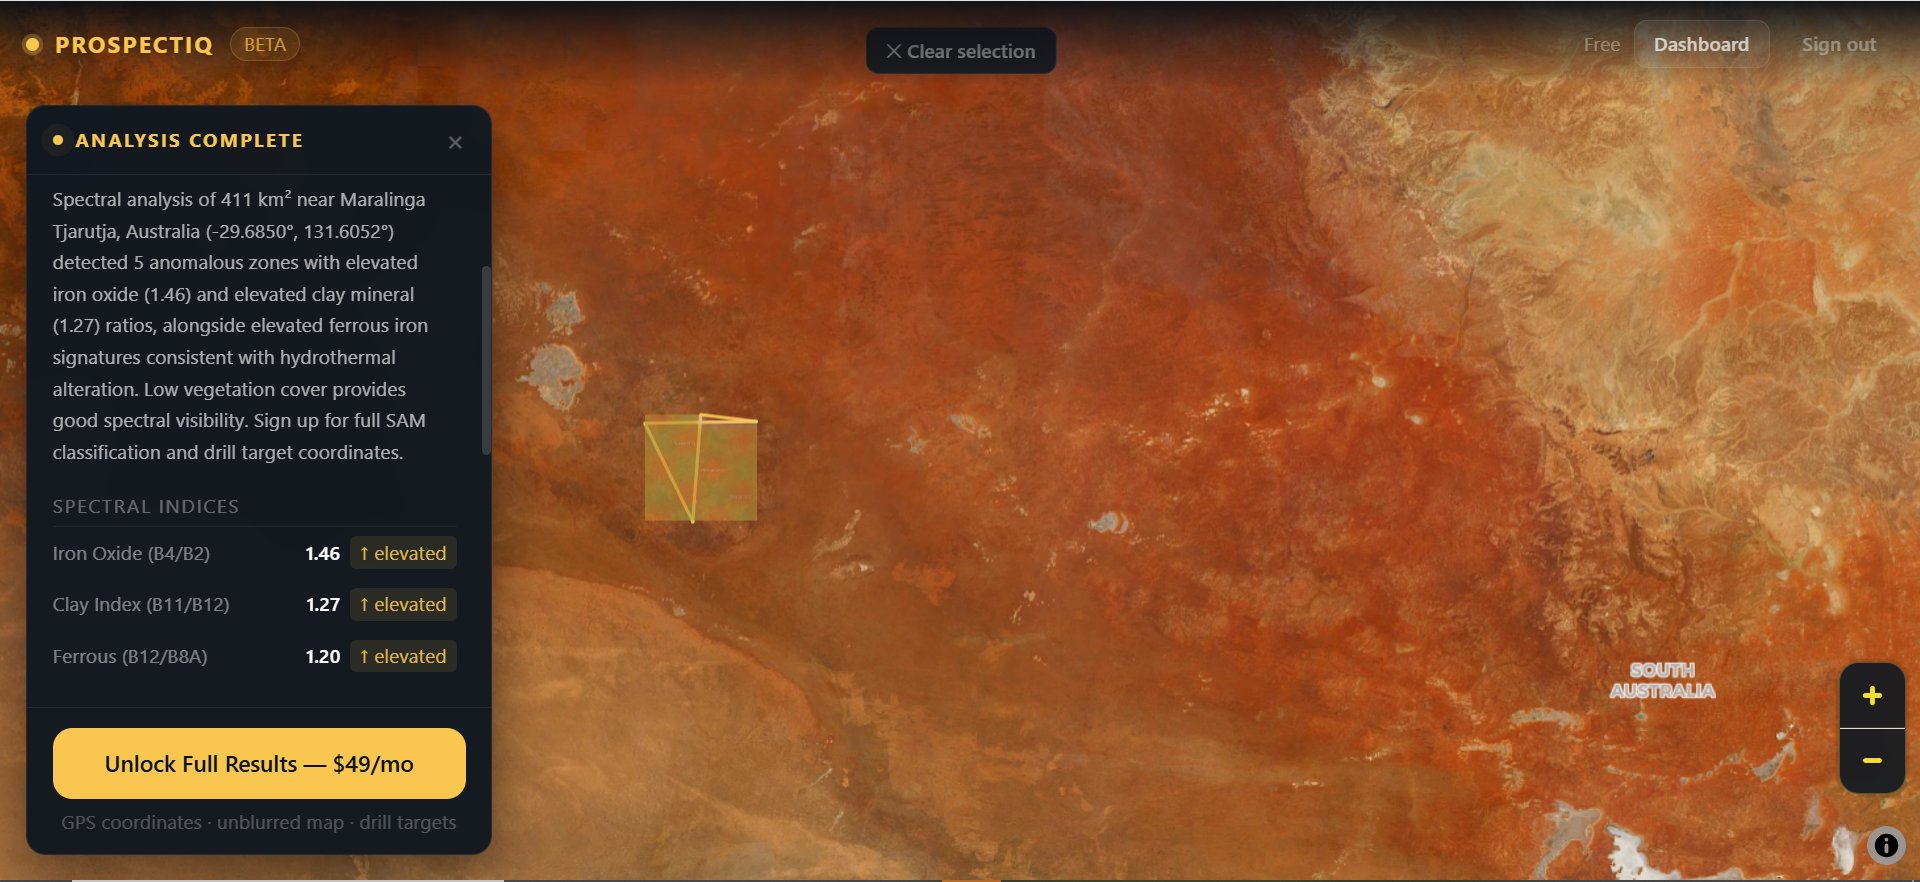
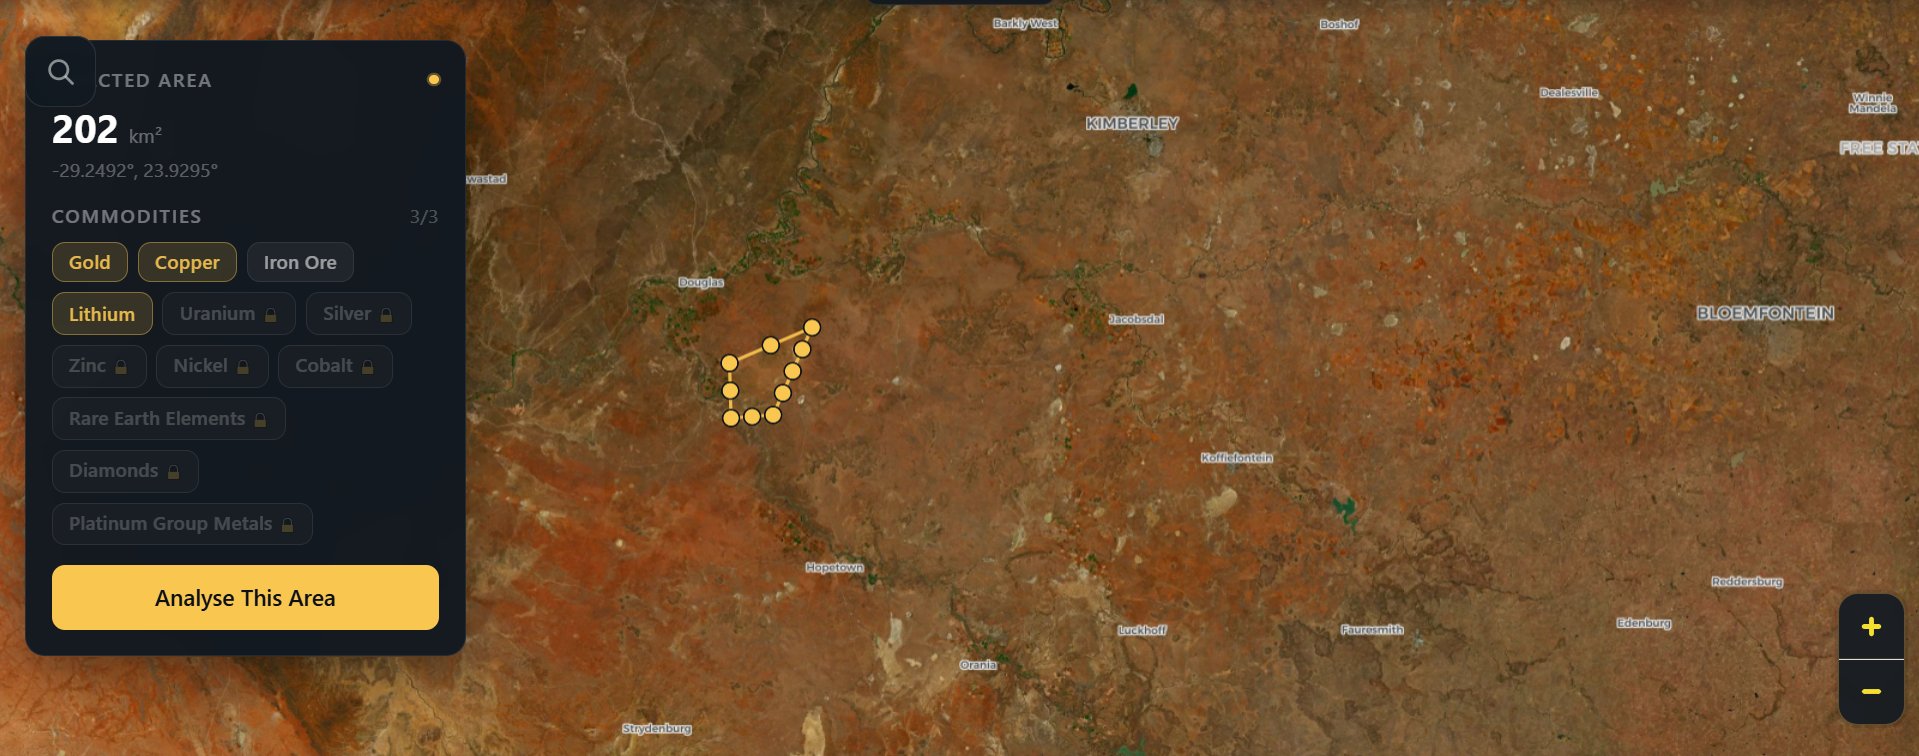
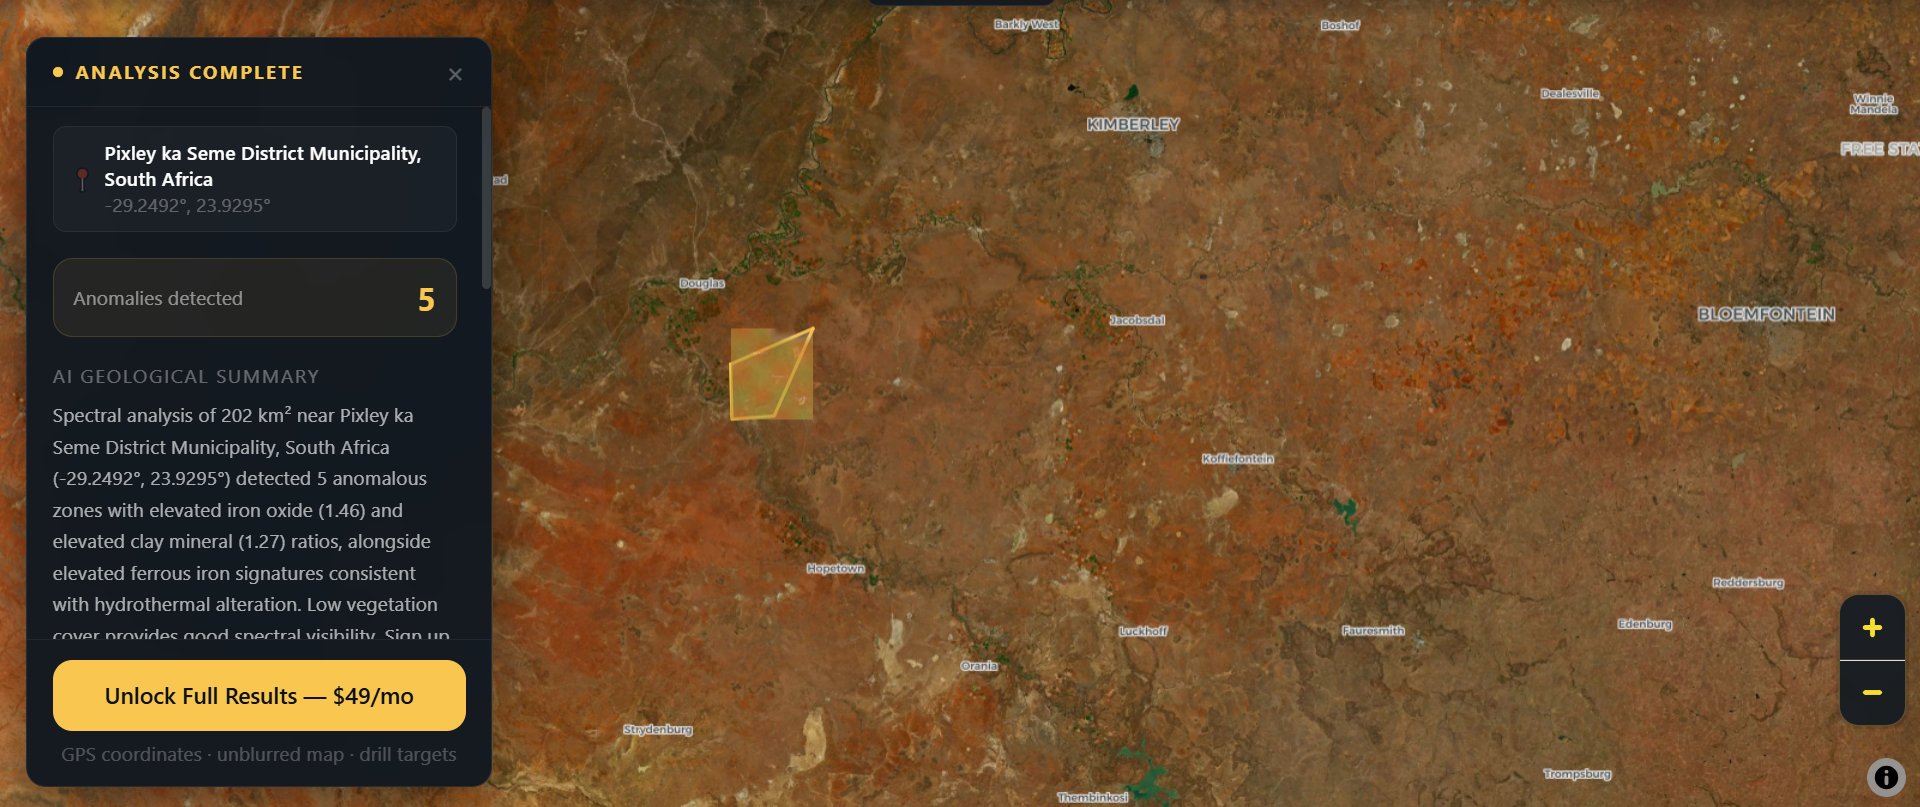
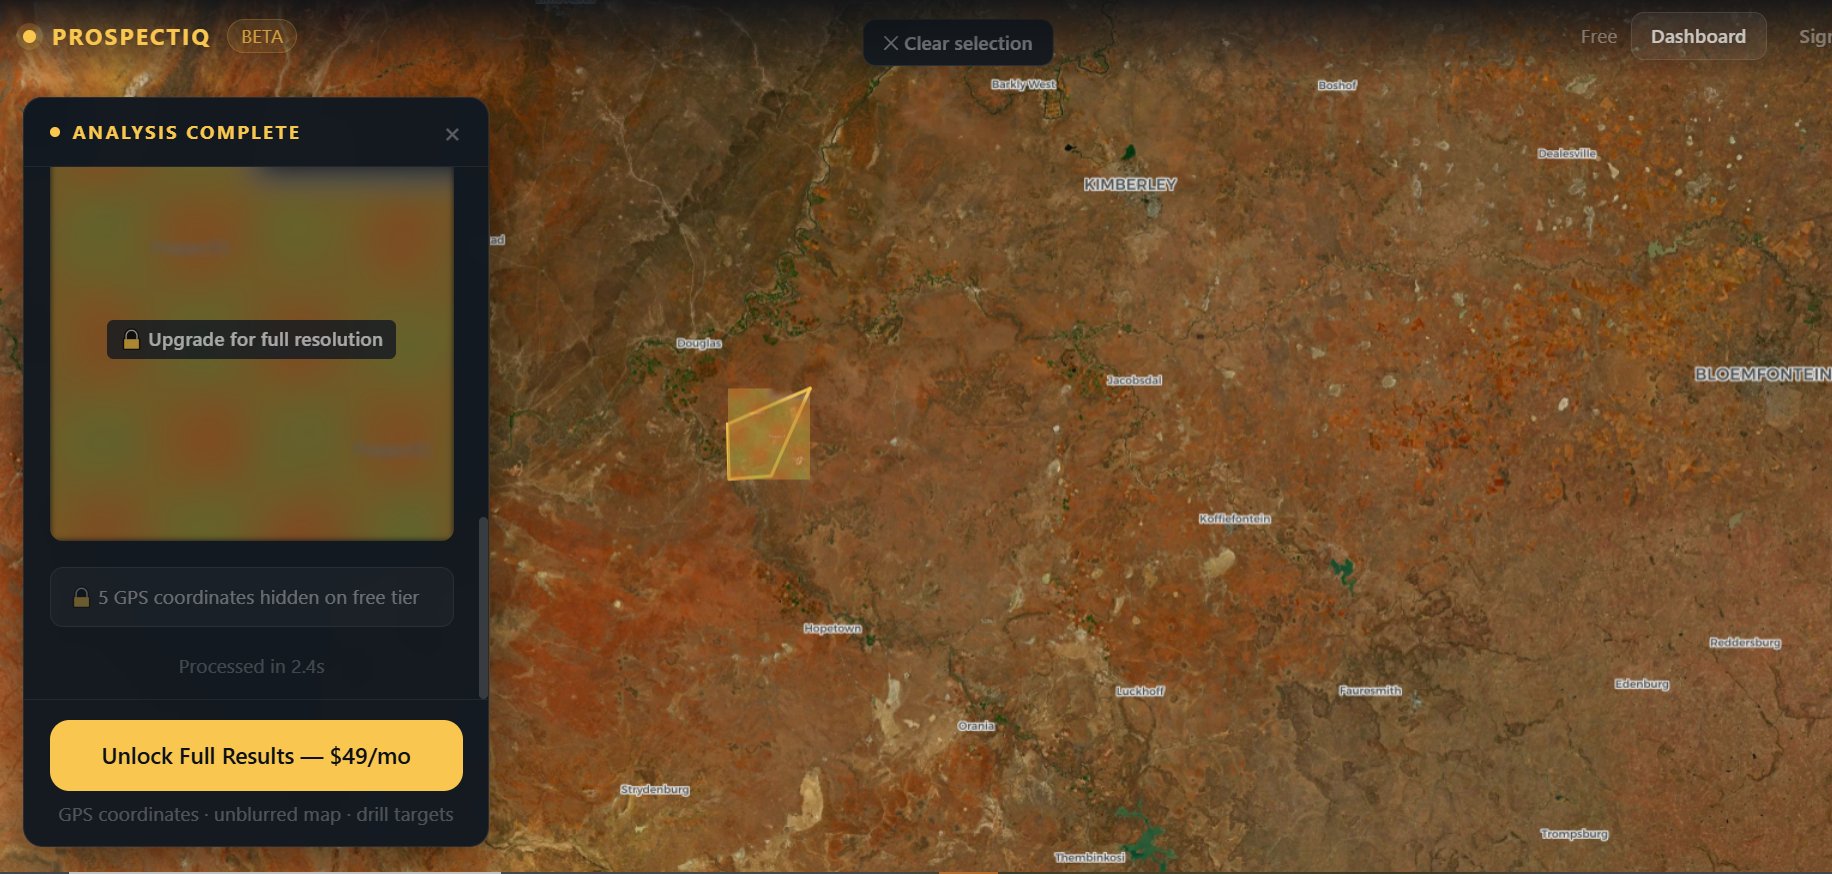
Try it on your own area of interest
ProspectIQ runs this analysis on any location on Earth. Draw a polygon on the satellite map, pick your target commodity, wait about a minute. You get band ratio indices, SAM mineral identification, anomaly counts, and a geological summary with the nearest place name and country. Three free analyses per month, no card needed. GPS coordinates for anomaly targets and the full unblurred heat map start at $49/month.