Spectral Angle Mapper is the algorithm you will meet in almost every paper on satellite mineral exploration. It shows up in academic work on the Atacama, in commercial platforms charging $600 per month, and in every free tool worth using. If you are going to interpret satellite results for gold targeting, you need to know what SAM is doing under the hood and what it will not tell you.
What band ratios cannot do
Band ratios are fast and useful for screening. The Iron Oxide Ratio (B04/B02) or the Clay Mineral Index (B11/B12) will tell you that ferric iron or clay minerals are elevated in a pixel. That is a yes-or-no question. What they will not tell you is which iron mineral. Goethite, hematite, jarosite, or just bright limestone in arid terrain all push the iron oxide ratio above the threshold. You cannot separate them with two bands.
Ratios also shift with illumination and topography. A shadowed slope and a sunlit ridge with identical rock will give different ratio values. Ratios correct for some of this by design, but not enough when you are trying to prioritise drill targets.
SAM answers a different question. It looks at the full spectral curve of a pixel and compares it against a library of known mineral spectra. Not two bands. All of them.
How SAM works
Every pixel's spectrum is a vector in N-dimensional space, where N is the number of bands. For Sentinel-2 that is up to 13 dimensions. The SAM algorithm computes the angle between the pixel vector and a reference mineral vector from the USGS Spectral Library. The formula is the standard dot product:
cos(θ) = (A · B) / (||A|| × ||B||)
A is the pixel spectrum, B is the reference mineral spectrum. The output is an angle. Smaller angle, better match. A zero-degree match would mean an identical spectral shape, which never happens with real satellite pixels because every pixel is a mixture of several materials.
The useful property is what happens when you scale the vectors. The angle between two vectors does not change when one of them gets brighter or darker. So a shadowed hillside and a sunlit ridge of the same rock will produce the same SAM angle, even though their brightness values are wildly different. Band ratios cannot match this. That is the whole reason SAM exists.
The USGS Spectral Library
SAM is only as good as its reference spectra. ProspectIQ uses the USGS Spectral Library Version 7 (Kokaly et al., 2017), which contains laboratory reflectance curves for over 1,300 minerals measured from 0.2 to 200 µm. It is free, it is public, and it is what everyone else uses too. TerraEye, academic researchers, NASA missions, all of them draw from the same library.
For gold exploration, there is a catch. Gold does not have a spectral signature. Pure gold reflects visible light strongly but it has no diagnostic absorption features in the VNIR or SWIR wavelengths that Sentinel-2 or ASTER can see. You cannot find gold by looking for gold. You find it by looking for the minerals that travel with it.
Gold pathfinder minerals
These are the alteration minerals that form in and around gold-bearing systems. Hot hydrothermal fluids oxidise iron, break down feldspars into clays, and leave a distinctive mineral assemblage that persists long after the gold is deposited. SAM looks for the assemblage.
| Mineral | Formula | Why it matters for gold |
|---|---|---|
| Goethite | α-Fe³⁺OOH | Iron oxide cap above oxidised pyrite |
| Hematite | Fe₂O₃ | Iron oxide in gossans over Au-bearing veins |
| Jarosite | KFe³⁺₃(SO₄)₂(OH)₆ | Acid-sulphate oxidation — strong Au pathfinder |
| Kaolinite | Al₂Si₂O₅(OH)₄ | Argillic clay halo around Au deposits |
| Sericite | KAl₃Si₃O₁₀(OH)₂ | Phyllic alteration — porphyry and orogenic |
| Chlorite | (Mg,Fe)₅Al₂Si₃O₁₀(OH)₈ | Propylitic alteration halo |
Finding any single one of these does not mean gold. Finding several together, in a pattern that matches a known alteration system, does mean you should look closer.
SAM angle thresholds
SAM outputs an angle in radians or degrees for every pixel against every reference mineral. The thresholds most of the literature settles on:
| Angle | What it means |
|---|---|
| < 0.10 rad (5.7°) | High-confidence match — the reference mineral is probably there |
| 0.10-0.20 rad (5.7-11.5°) | Moderate match — likely present but mixed with other materials |
| 0.20-0.35 rad (11.5-20°) | Weak match — possible, needs ground-truth to confirm |
| > 0.35 rad (20°) | No match — the mineral is not detected |
These are starting points. Optimal thresholds depend on deposit type, vegetation cover, and how spectrally pure your pixels are. ProspectIQ uses 0.10 radians as the default cutoff for high-confidence detection, which matches the USGS approach.
SAM versus MTMF
Here is something SAM will not tell you: how much of the mineral is in the pixel. A pixel that is 10% jarosite and 90% quartz can produce a similar SAM angle to a pixel that is 80% jarosite. Both match the jarosite reference spectrum in shape. One is a weak signal in a noisy pixel and the other is a strong signal. SAM treats them the same.
Mixture Tuned Matched Filtering (MTMF) was built to fix this. It estimates the abundance of the target mineral within a pixel and flags cases where the match is spectrally ambiguous. MTMF returns two numbers: a match score and an infeasibility score. When the match score is high and the infeasibility score is low, you have a real detection with real abundance. When the match score is high but the infeasibility score is also high, the low SAM angle was an artefact and you should not trust it.
You use SAM alone for regional screening and arid terrain with exposed bedrock. You add MTMF when pixels are mixed, when you are ranking drill targets by priority, or when you are working in Carlin-style systems where sub-pixel mixing is the rule. ProspectIQ's Explorer tier ($149/month) includes both. The free tier is band ratios only.
Cloud masking and vegetation
SAM accuracy collapses when clouds, shadows, or vegetation contaminate a pixel. Sentinel-2 ships a Scene Classification Layer (SCL) that labels every pixel before SAM runs. Clouds (SCL 8, 9, 10) and shadows (SCL 3) get masked out. Water (SCL 6) is excluded entirely. Dense vegetation pixels are flagged for reduced confidence rather than removed.
Vegetation is handled through NDVI, calculated as (B8A - B04) / (B8A + B04). Below 0.2 is bare rock or soil, full confidence. Between 0.2 and 0.4 is sparse vegetation, confidence reduced by 20%. Between 0.4 and 0.6 is moderate cover, confidence reduced by 40%. Above 0.6 is dense vegetation and the mineral signal is heavily attenuated.
Any SAM result under NDVI above 0.6 should be treated as a reconnaissance lead, not a drill target. The canopy is absorbing most of the SWIR signal you would need to confirm the mineral. ProspectIQ reports vegetation cover for every anomaly so you can weight your targets accordingly.
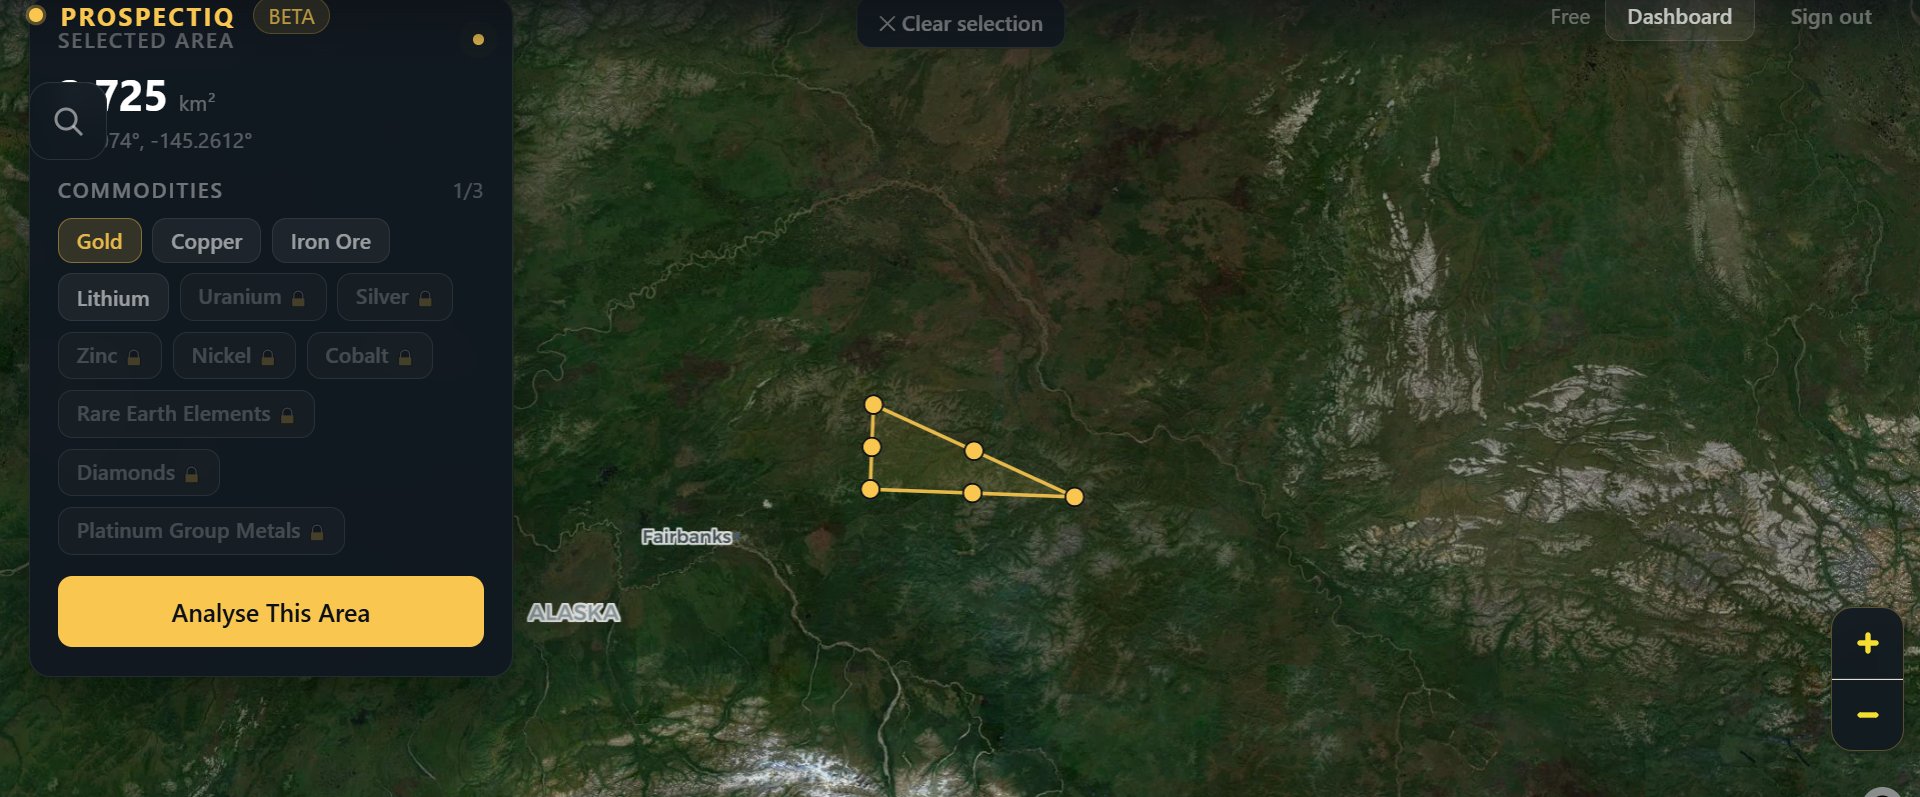
Worked example: Tintina Gold Province, Alaska
The Fairbanks district sits within the Tintina Gold Province, which stretches from the Yukon through central Alaska and hosts over 90 million ounces of documented gold resources. The deposits are predominantly intrusion-related orogenic gold systems — quartz veins and disseminated mineralisation in altered sedimentary and igneous host rocks.
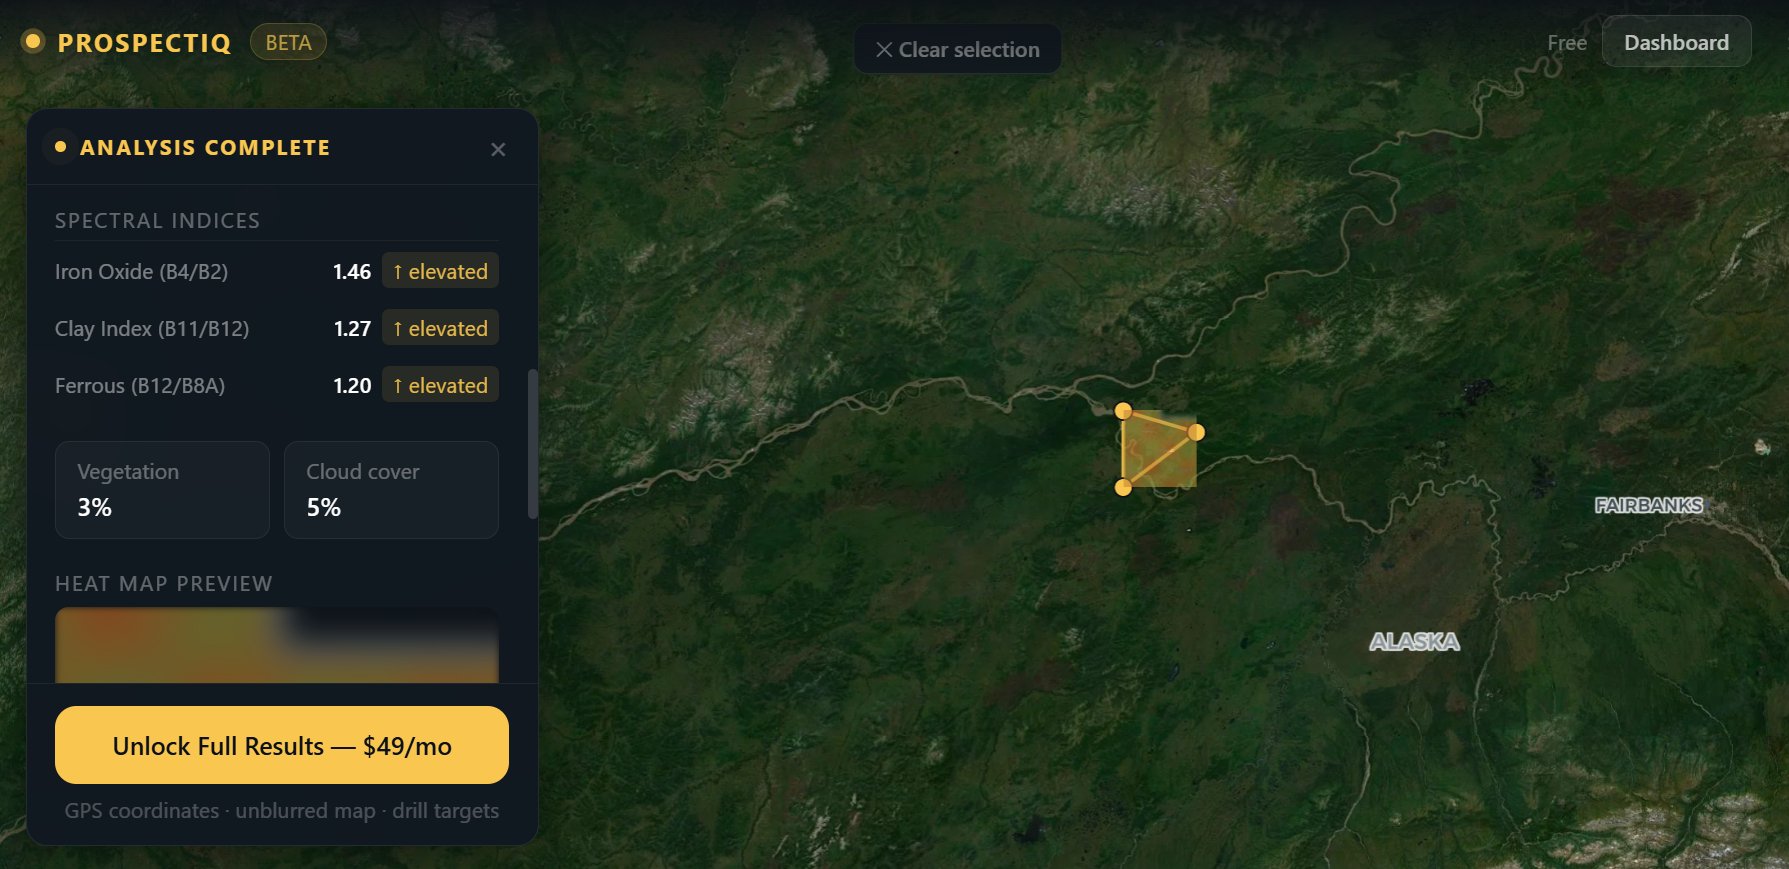
Running a ProspectIQ analysis on a 279 km² area within the Tintina province returned five anomalous zones with elevated iron oxide (1.46), clay mineral (1.27), and ferrous iron (1.20) ratios. All three indices point to hydrothermal alteration.
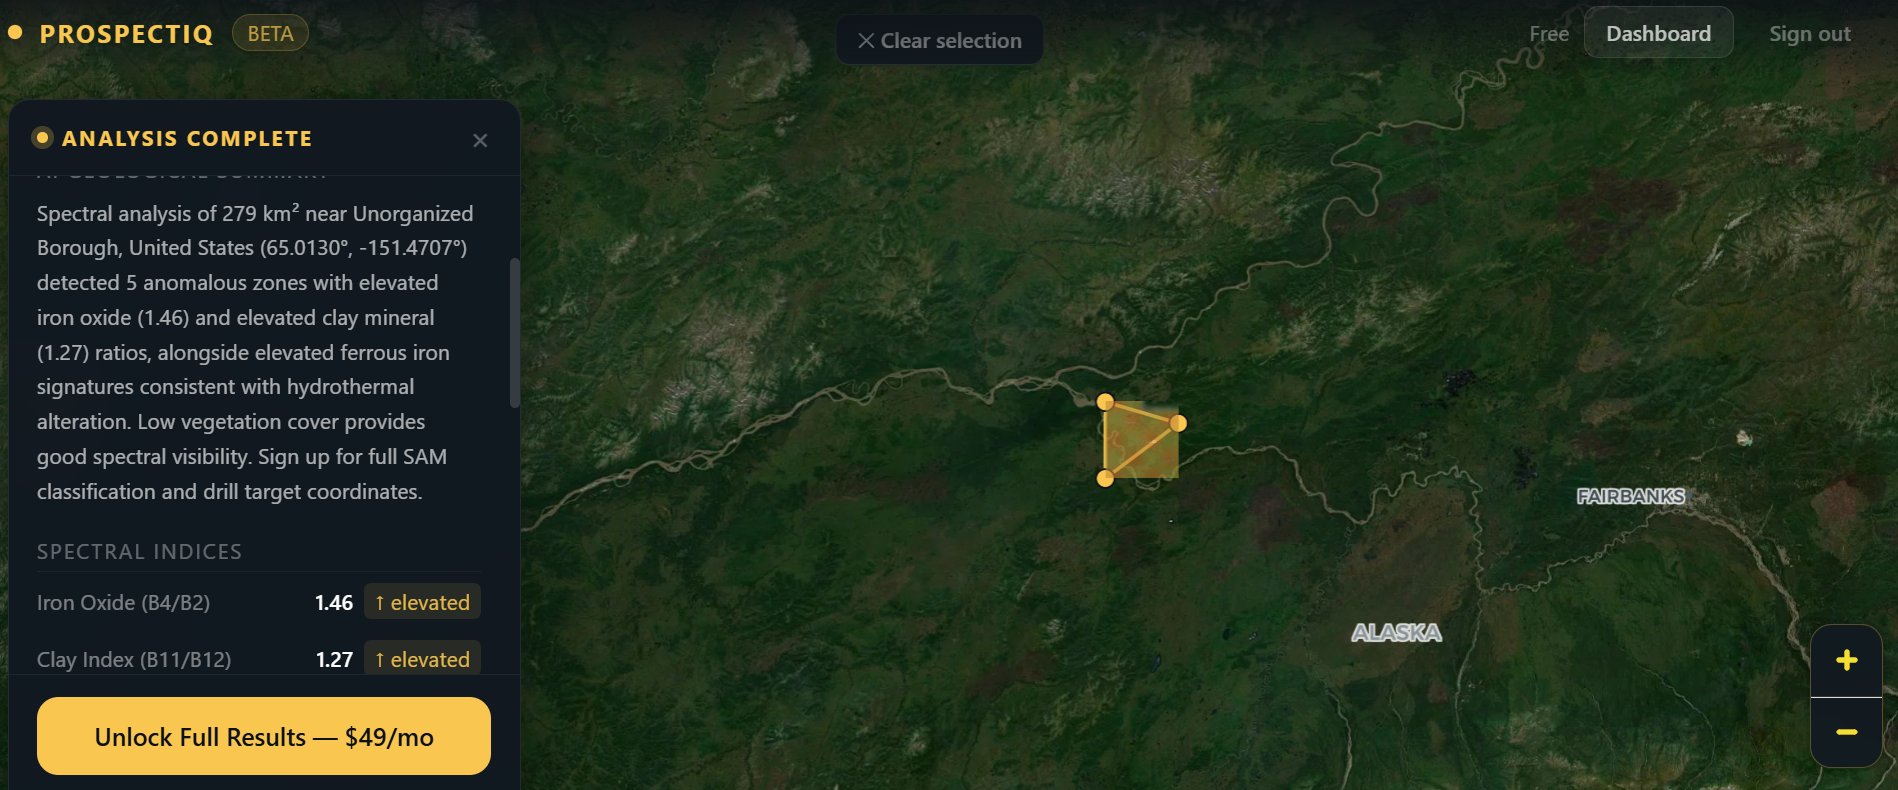
The value of seeing all three ratios elevated at once is that they rarely coincide by accident. Iron oxide alone could be BIF or weathered mafic rock. Clay alone could be sedimentary cover. Ferrous iron alone could be unaltered basalt. All three together in the same polygon, with less than 5% vegetation cover, points to a real alteration system worth investigating.
The SAM classification in the Explorer tier would then name the specific minerals: likely goethite for the iron oxide signal, kaolinite or sericite for the clay, and chlorite for the ferrous signature. That combination — iron oxide cap, argillic clay halo, propylitic chlorite — is the textbook alteration zonation around an intrusion-related gold system.
Reading SAM results for drill targeting
A SAM anomaly on its own is not a drill target. It tells you a particular mineral's spectral signature was detected at a particular pixel. Drill prioritisation needs structural context and geological knowledge on top of the spectral result.
ProspectIQ's SAM output for each anomaly target includes an ID, centroid coordinates (EPSG:4326), SAM angle in degrees, the dominant reference mineral, vegetation cover percentage, and the MTMF abundance score on Explorer+ tiers.
For ranking targets:
- Highest priority: SAM angle below 0.10 rad, vegetation cover under 40%
- Moderate: SAM angle below 0.12 rad, vegetation 40-60%
- Low: SAM angle 0.12-0.20 rad — needs geological justification before drilling
- Exclude: Any anomaly with MTMF infeasibility above 0.5
Cross-reference against structural context: proximity to faults, shear zones, and fold axes; structural settings that match the target deposit type; known deposit types in the belt (orogenic, epithermal, Carlin-style). A high-confidence spectral anomaly sitting on a fault intersection in a productive belt is a drill target. The same anomaly in the middle of an unaltered batholith is noise.
What SAM cannot do
Honest limitations matter more than feature lists. Here is where SAM fails:
- Detect gold directly. Gold has no spectral signature in the wavelengths satellites see. You detect alteration, not the metal.
- Replace drilling. SAM narrows where to drill. Only the drill confirms what is actually down there.
- Penetrate thick canopy. NDVI above 0.7 blocks most of the SWIR signal. Rainforest targets need different tools.
- Give abundance without MTMF. SAM angle correlates loosely with mineral fraction but is not a quantitative estimate.
- Separate spectrally similar minerals. Kaolinite and montmorillonite look almost identical on Sentinel-2. You need ASTER or hyperspectral data to tell them apart reliably.
- See through clouds. Sentinel-2 revisits every 5 days. In tropical wet seasons you wait.
Try it on your target
SAM classification is on the Explorer tier ($149/month) and above. The free tier gives you band ratios, which is enough for screening but not for naming the minerals. For a first pass on an unfamiliar area, the free tier tells you whether anomalies exist. SAM on Explorer tells you what they are made of.